Written by Noam Zweig, System Architect
The Challenge: Presenting Rapidly Changing Weather Parameters
It’s so obvious that many of us aren’t even aware of how dependent we are on knowing what the weather will be like in the near future.
However, most of us aren’t meteorologists. We have neither the time nor expertise to toggle back and forth between different weather models and understand which information is most relevant to us.
Is there a way to effectively assimilate those models and observations so it’s easier to view and understand the weather?
We here at Tomorrow.io work with different data models and observations in different areas around the world. Assimilating them in a user friendly fashion is a major technical challenge.
But the challenge becomes even more complex when we consider:
- Different weather parameters
- Different time frames
- Rapidly changing forecasts
And let’s not forget that all these factors need to seamlessly come together on a single map, presented in a clear, easy to read manner.
This is a user-experience issue that presents a complex technical challenge that I will now tackle in this article.
Simple is Beautiful: The Tomorrow.io Approach
 Doing the stitch
We wanted to keep things simple for the user.
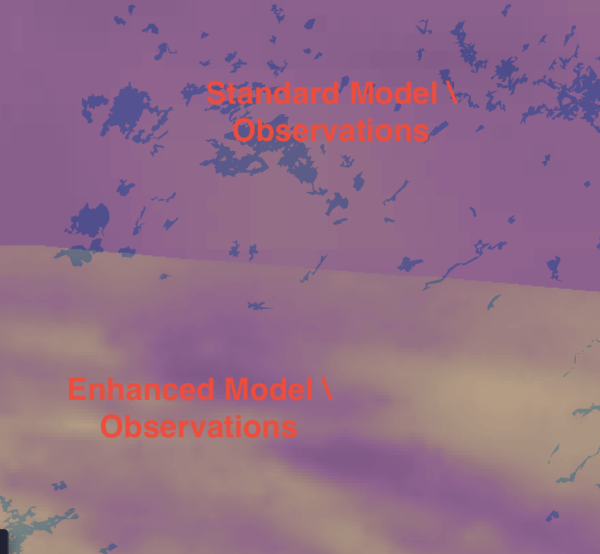
The solution: stitching. Tomorrow.io weather experts know which of our data models are most relevant – and in which areas of the world to use them. Our idea is to stitch all the models together over one layer and present it to the user.
Talking 010101
Now it’s time to deep dive into the technical stuff.
Please note that if you’re familiar with the technical aspects of tiles and how map clients use tiles, feel free to skip to the solution section.
Tiles. It’s All About Tiles
Whoever wants to present a map with different layers needs to work with tiles.
How does this work?
This brief explanation will give you a broad overview of the process.
The different layers are split into tile grids with a predefined tile pixel size (usually 256×256, 512×512, 4096×4096). On one end, we have the tile-server that can serve tiles. On the other, we have the client-facing map component that’s able to ask for the correct tiles for the viewport being presented. A client asks to see the x,y tile on the grid and the server returns the tile in the requested row and column.
But maps also have different zoom levels. The lowest zoom (let’s call it 0) shows a map of the world in one view (actually, one tile). The highest zoom (usually around 18) shows a very detailed view, so that the map can focus on an area as small as a few meters.
How do we support zoom?
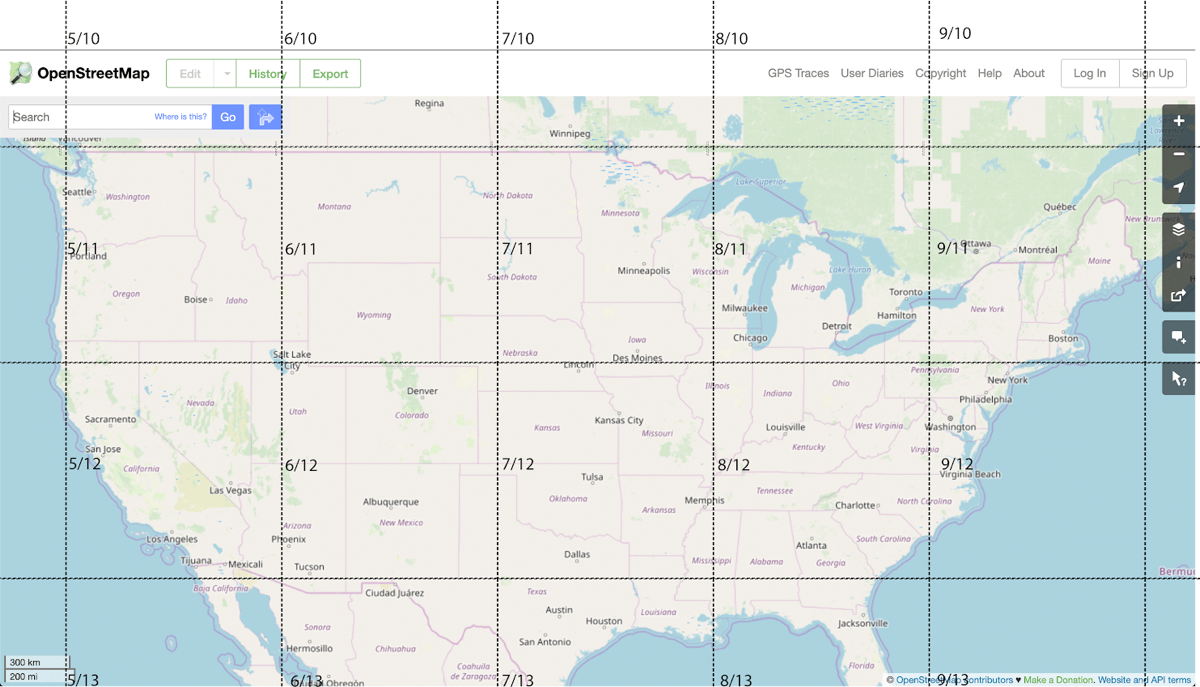
This is pretty standard. The highest zoom level has 1 tile. Each zoom level takes the former zoom level and splits it into 4. So in a zoom level of 1 we have 4 tiles. In a zoom level of 2 we have 16 tiles, and so on. In each zoom level we have 4zoom tiles. For example, here’s a viewport of the U.S. at a zoom level of 5:
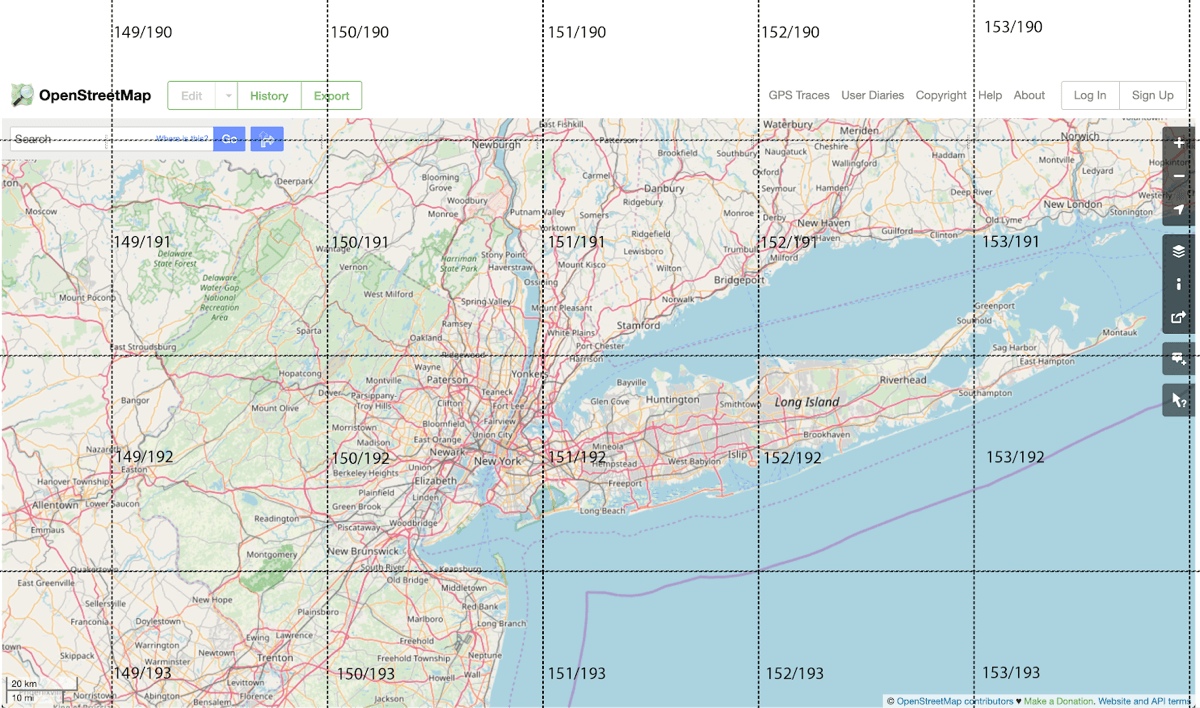
And here’s a zoom level 9 around New York:
And again, the map component and tile servers should support it. Usually, it is supported in the url format. The tile server accepts (zoom, x, y) as a url – “https://tileserver/{zoom}/{x}/{y}.png“.
When You Say Tile, Do You Mean Brick?
We now know how to request a tile from a server. But what’s a tile?
There are two main tile types:
- Raster: Basically a bitmap. An image that represents each and every pixel in the tile usually png.
- Vector: A vector representation of the different shapes (polygons, etc.) inside the tile. A popular format is mvt (mapbox vector tile).
Tip: To dig deeper into the pros and cons of each format just google “vector vs. raster tiles” and you’ll find this debate to be as complicated and endlessly fascinating as I do.
Prepare the Sewing Needle – The Solution
Having defined the challenge and described the technology, let’s see what the solution is.
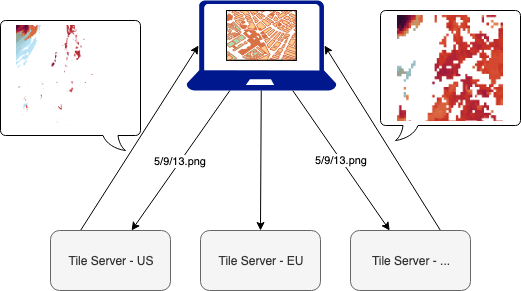
But first, let’s review what the situation was before we started our work:
- We had tile servers that serve 256×256 raster tiles.
- The tiles are pre-colored, and re-generated each time we have a new forecast.
- Different tile servers serve different sources. One server for the U.S., one server for the EU, etc.
And now for the solution:
There are several moving parts to keep in mind:
- Weather data such as temperature, humidity and precipitation that’s always changing.
- Source boundaries like the area of the U.S that rarely change.
So each time we get new data, we need to stitch it according to the source boundaries. Since they rarely change, the boundaries can be prepared in advance.
After we prepared the boundaries in advance, we handled the tile requests.
Then, when a tile is requested, we check if this tile contains information from different sources. Now, we have two options:
- If a tile’s from only one source simply serve that tile.
- If a tile contains data from multiple sources we need to gather all the sources and stitch them together.
Here we have two approaches to stitching tiles. In both, you need to understand what the borders are and stitch the data accordingly. Each approach has its own advantages:
- Server side: Do it once, use it everywhere (android, iOs, web).
- Client side: All the visualization is on the client side. The server serves only data.
We chose the server side. Is it the ideal approach? No. Is it working? And how.
How Does It Work?
Metadata Database
First, we created a metadata database that includes for each weather-parameter, zoom, x and y:
- Sources that are needed for this tile.
- Mask (one channel, black & white png) for each source. White, where this source should be presented, and black where it should not. This mask is created according to the source boundaries.
How do we do it?
We start with a geojson file that we created and include the definition of the boundaries for each source. The geojson also includes a property with the name of the source.
Example (json):
{
  "type": "FeatureCollection",
  "features": [
    {
      "type": "Feature",
      "properties": {
        "name": "US",
        "region": "us"
      },
      "geometry": {
        "type": "Polygon",
        "coordinates": ...
      }
    },
    {
      "type": "Feature",
      "properties": {
        "name": "EU",
        "region": "eu"
      },
      "geometry": {
        "type": "MultiPolygon",
        "coordinates": ...
      }
    }
  ]
}
We go over all the required zoom levels (we stopped at zoom 10), and for each:
1. Extract the geojson of all the tiles – using geojson-vt (javascript):
const geojsonObj = getJSON(`${geojsonFileName}.geojson`);
const tileIndex = geojsonvt(geojsonObj, { extent: 256, tolerance: 0, buffer: 1 });

for (let x = 0; x < TILE_ROW_COL; ++x) {
  for (let y = 0; y < TILE_ROW_COL; ++y) {
    const tileGeoJson = tileIndex.getTile(zoom, x, y);
  }
}
2. Generate for each feature (reminder: feature = source):
a. Metadata descriptor (json):
{"zoom":5,"x":10,"y":10,"partlets": [{"region":"us"},{"region":"global"}]}
b. Mask file\s:
And its negative:
Here is how we generate the mask file, using opencv4nodejs:
- Create the mask file, with black fill (javascript):
const TILE_SIZE = 256; const FILL_COPY = 255; const FILL_NO_COPY = 0; function addPolyToMask({ poly, fill, mask }) { const pts = poly.map(point => new cv.Point2(point[0], point[1])); mask.drawFillPoly([pts], new cv.Vec3(fill, fill, fill), cv.LINE_AA); } function generateTileMask({ tileGeometry }) { // Creating an empty mask const mask = new cv.Mat(TILE_SIZE, TILE_SIZE, cv.CV_8UC1, FILL_NO_COPY); // Adding the first polygon - the exterior addPolyToMask({ poly: tileGeometry[0], fill: FILL_COPY, mask }); // If there is are holes, draw them tileGeometry.forEach((poly, ind) => { // Skip the exterior if (ind > 0) { handleNestedInteriorPolygon({ mask, poly }); } }); return mask; } function handleNestedInteriorPolygon({ mask, poly }) {} - Add internal polygons as holes (this is how a polygon is represented in geojson):
const TILE_SIZE = 256;
const FILL_COPY = 255;
const FILL_NO_COPY = 0;

function addPolyToMask({ poly, fill, mask }) {}

function handleNestedInteriorPolygon({ mask, poly }) {
  // Create a copy of the mask as it is now
  const maskBefore = mask.copy();

  // Adding the polygon as a hole in the exterior polygon
  addPolyToMask({ poly, fill: FILL_NO_COPY, mask });

  // Check if it changed something in the mask
  const diff = mask.bitwiseXor(maskBefore);
  const diffSum = diff.countNonZero();

  // If not => it is a hole in one of the interior polygons
  if (diffSum === 0) {
    addPolyToMask({ poly, fill: FILL_COPY, mask });
  }
}
Bottom line: We have metadata and masks.
Tile Proxy Server
Then, we created a tile proxy-server.
The tile proxy-server uses the metadata and the masks that were generated in the previous step, and for each request:
- Find out if there’s more than one source (if so, just pipe it to the client from the original tile-server).
- Fetch the tiles from the original tile-servers.
a. For each tile, mask it with its mask.
b. Blend all the masked tiles into one tile.
This is what the stitch and blend code looks like (javascript):
/**
 * Stitch several images together. Receives a map of images, and masks
 * stitch the images together
 * @param arrImagesMasks - an array of objects: {image: , mask: }
 * @returns stitched image according to masks
 */
function stitchImageBuffers({ arrImagesMasks }) {
  // Creating an empty image to build the final picture
  let finalImage = new cv.Mat(TILE_SIZE, TILE_SIZE, cv.CV_32SC4, [0, 0, 0, 0]);

  arrImagesMasks.forEach((imgAndMask) => {
    if (!imgAndMask.image) {
      throw new ApplicationError({ message: "Invalid Image. Image is empty" });
    }
    const uintImage = new Uint8Array(imgAndMask.image);
    let cvImg = cv.imdecode(uintImage, cv.IMREAD_UNCHANGED);

    const { mask } = imgAndMask;
    finalImage = cvImg.copyTo(finalImage, mask);
  });
  return finalImage;
}
We used the “copyTo” with mask to copy only the relevant part from the original tile and add it to the final “stitched” tile.
This is what the architecture looks like now:
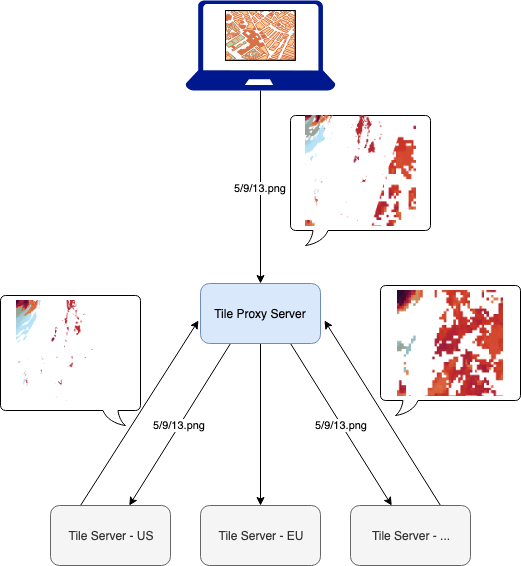
- Client – sends request to {parameter}/{zoom}/{x}/{y}.png (agnostic to sources).
- Tile proxy – receives the request:
- Fetch the source-tiles
- Stitch
- Return the stitched tile
This works really fast and allows us to cache on top of the tile-proxy.
A Bit About the Technology and Tools
We used the following tools and open sources:
- geojson files that define the borders of the different sources.
- geojson-vt to translate the geojson to tiles (according to zoom x, y)
- opencv (using opencv4nodejs) to create the different masks.
- turf for polygon calculations.
- A very good debug page, supplied by mapbox http://mapbox.github.io/geojson-vt/debug/. You can simply drag a geojson and it lets you zoom in and out, understanding the exact tiles zoom, x, y.
Conclusion
The user-experience issue of presenting a clear weather picture created a technical challenge. The server-side stitching solution described above works great for us.
And this is also a great solution for use cases where different data from different sources needs to be presented together over a map.
Enjoy!